CMS News
FOR IMMEDIATE RELEASE
February 23, 2017
Market Saturation and Utilization Data Tool
The Centers for Medicare & Medicaid
Services (CMS) has developed a Market Saturation and Utilization Data Tool,
formerly called the Moratoria Provider Services and Utilization Data Tool, that
includes interactive maps and a dataset that shows national-, state-, and
county-level provider services and utilization data for selected health service
areas. Market saturation, in the present context, refers to the density of
providers of a particular service within a defined geographic area relative to
the number of the beneficiaries receiving that service in the area.
The fourth release of the data tool
includes a quarterly update of the data to the eight health services areas from
release 3, and also includes Physical and Occupational Therapy and Clinical
Laboratory (Billing Independently) data. Release 4 will therefore include four,
twelve-month reference periods and the following health service areas: Home
Health, Ambulance (Emergency, Non-Emergency, Emergency & Non-Emergency),
Independent Diagnostic Testing Facilities (Part A and Part B), Skilled Nursing
Facilities, Hospice, Physical and Occupational Therapy, and Clinical Laboratory
(Billing Independently).
The Market Saturation and
Utilization Data Tool can be used by CMS to monitor and manage market
saturation as a means to prevent fraud, waste, and abuse. The data can
also be used to reveal the degree to which use of a service is related to the
number of providers servicing a geographic region. Provider services and
utilization data by geographic regions are easily compared using an interactive
map. There are a number of research uses for these data, but one objective of
making these data public is to assist health care providers in making informed
decisions about their service locations and the beneficiary population they
serve. The tool is available through the CMS website at: https://data.cms.gov/market-saturation.
Future releases may include comparable information on additional health service
areas.
Methodology
The analysis is based on paid
Medicare claims data from the CMS Integrated Data Repository (IDR). The IDR
contains Medicare and Medicaid claims, beneficiary data, provider data, and
plan data. Claims data are analyzed for a 12-month reference period, and
results are updated quarterly to reflect a more recent 12-month reference
period.
The Market Saturation and
Utilization methodology is different from other public use data with respect to
determining the geographic location of a provider. In this analysis, claims are
used to define the geographic area(s) served by a provider rather than the
provider’s practice address. Further, a provider is defined as “serving a
county” if, during the 12-month reference period, the provider had paid claims
for more than ten beneficiaries located in a county. A provider is defined as
“serving a state” if that provider serves any county in the state.
The Market Saturation and
Utilization methodology is also different from other public use data with
respect to determining the number of Medicare beneficiaries who are enrolled in
a fee-for-service (FFS) program. In this analysis, a FFS beneficiary is defined
as being enrolled in Part A and/or Part B with a coverage type code equal to
“9” (FFS coverage) for at least one month of the 12-month reference period.
There must not be a death date for that month or a missing zip code for the
beneficiary so that the beneficiary can be assigned to a county. Other public
use data may define a FFS beneficiary using different criteria, such as
requiring the beneficiary to be enrolled in the FFS program every month during
the reference period.
The Market Saturation and
Utilization Data Tool includes an interactive map that is color-coded based on
an analysis that separates the distribution into the following categories of
states/counties for the selected metric: lowest 25 percent, second lowest 25
percent, third lowest 25 percent, top 25 percent excluding extreme values, and
extreme values. An extreme value is one that greatly differs from other
values in its field (e.g., Number of Providers). For those interested in states
and counties affected by CMS’ temporary provider enrollment moratoria during
the reference periods for which data are available, the interactive map permits
a visualization that identifies those states and counties. In this
visualization, ambulance and home health service areas for moratoria versus
non-moratoria states/counties are also identified based on color scheme.
Counties that are excluded from the analysis are colored gray in the
interactive map.
The examples below utilize the
Ambulance (Emergency & Non-Emergency) service area data (selected for
illustration purposes only). Similar maps can be created through the Data Tool
for all of the health service areas included in the fourth release and for the
four, twelve-month reference periods: 2014-10-01 to 2015-09-30, 2015-01-01 to
2015-12-31, 2015-04-01 to 2016-03-31, and 2015-07-01 to 2016-06-30.
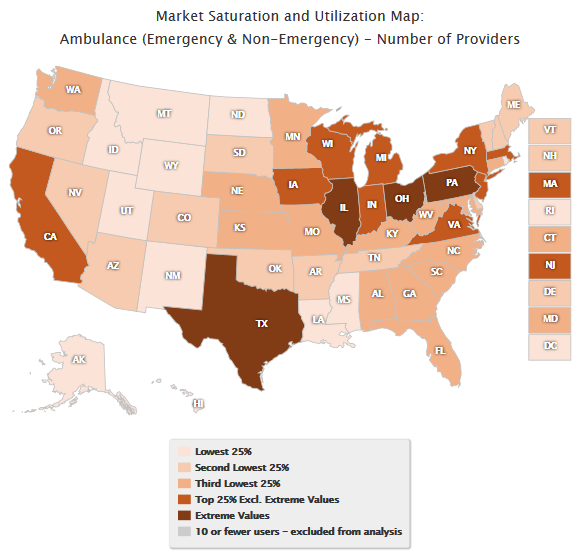
Map 1 displays the distribution of
providers by state for the Ambulance (Emergency & Non-Emergency) service
area for the October 1, 2014 through September 30, 2015 reference period. This
map utilizes a single color scale, which does not distinguish between moratoria
and non-moratoria states.
Map 1. Ambulance (Emergency & Non-Emergency):
National Distribution of
Number of Providers
October 1, 2014 – September
30, 2015
Single Color Scale
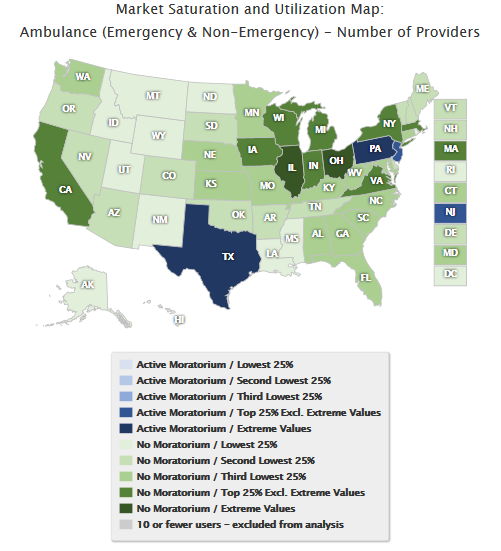
Map 2 displays the
distribution of providers by state for the October 1, 2014 through September
30, 2015 reference period. This map utilizes a dual color scale, which
distinguishes between moratoria and non-moratoria states.
Map 2. Ambulance (Emergency & Non-Emergency):
National Distribution of Number of Providers
October 1, 2014 – September 30, 2015
Color by Moratoria Status
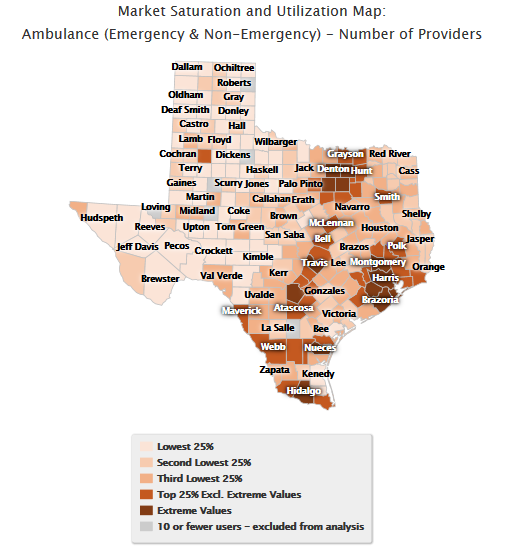
Map 3 drills down to the
county level and displays the distribution of providers by county within the
State of Texas for the October 1, 2014 through September 30, 2015 reference
period. This map utilizes a single color scale, which does not distinguish
between moratoria and non-moratoria counties.
Map 3. Ambulance
(Emergency & Non-Emergency):
County Distribution of Number of Providers
October 1, 2014 – September 30, 2015
Single Color Scale
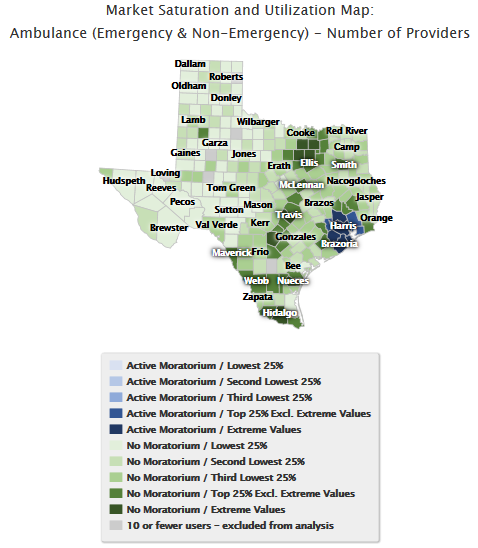
Map 4 drills down to the
county level and displays the distribution of providers by county within the
State of Texas for the October 1, 2014 through September 30, 2015 reference
period. This map utilizes a dual color scale, which distinguishes between
moratoria and non-moratoria counties.
Map 4. Ambulance (Emergency & Non-Emergency):
County Distribution of Number of Providers
October 1, 2014 – September 30, 2015
Color by Moratoria Status
Similar maps can be created
at the national- and state-level for the other metrics included in the Data
Tool: Number of FFS Beneficiaries, Average Number of Users per Provider,
Percentage of Users out of FFS Beneficiaries, and Average Number of Providers
per County.